From now on we Elev8
We're more than just a broker. We're an all-in-one trading ecosystem—everything you need to analyse, trade, and grow is in one place. Ready to elevate your trading?
We're more than just a broker. We're an all-in-one trading ecosystem—everything you need to analyse, trade, and grow is in one place. Ready to elevate your trading?
USD/INR trades near 69.40 as it took another U-turn from 21-day SMA during early Monday.
The pair now seems to head towards seven-week-old descending trend-line at 69.60, a break of which can recall 69.85 and 70.15 during the further rise.
In a case where prices rally beyond 70.15, a downward sloping resistance-line since October 2018, at 70.50 could gain market attention.
On the downside, a daily closing under 21-day simple moving average (SMA) level of 69.10 can recall 68.80 and 68.60 on the chart.
However, March month low near 68.30 could limit the pair’s further declines beneath 68.60, if not then 68.00 can please sellers.
USD/INR daily chart
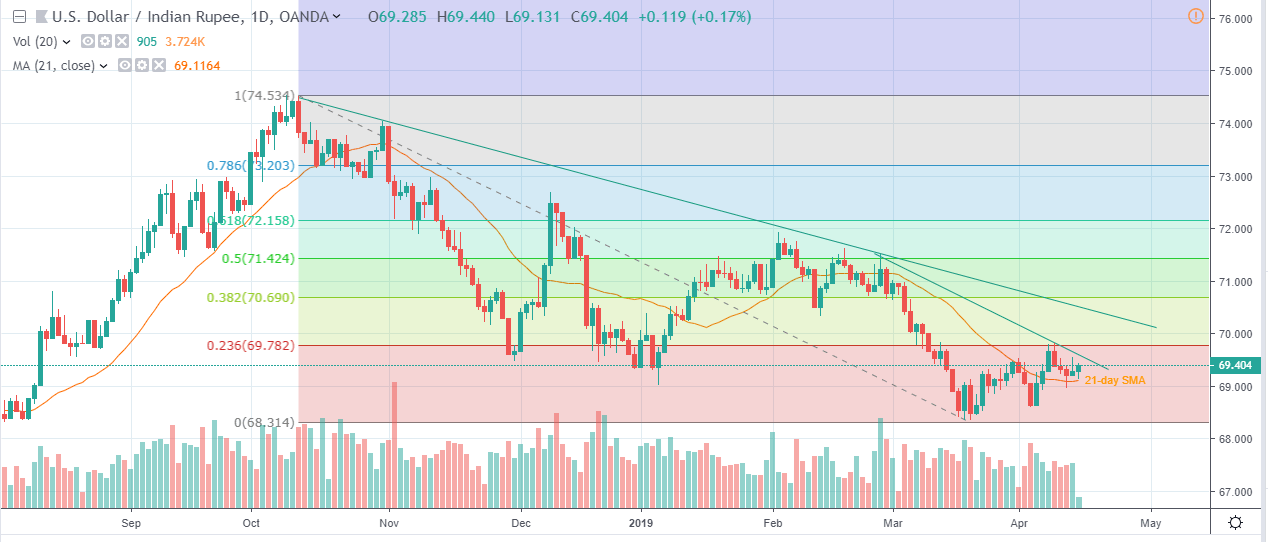
Trend: Bearish