اب سے ہم Elev8 ہیں
ہم صرف ایک بروکر نہیں ہیں۔ ہم ایک جامع ٹریڈنگ ایکوسسٹم ہیں—ہر چیز جو آپ کو تجزیے، ٹریڈ اور ترقی کے لیے درکار ہو، ایک ہی جگہ پر ہے۔ کیا آپ اپنی ٹریڈنگ کو بلند کرنے کے لیے تیار ہیں؟
ہم صرف ایک بروکر نہیں ہیں۔ ہم ایک جامع ٹریڈنگ ایکوسسٹم ہیں—ہر چیز جو آپ کو تجزیے، ٹریڈ اور ترقی کے لیے درکار ہو، ایک ہی جگہ پر ہے۔ کیا آپ اپنی ٹریڈنگ کو بلند کرنے کے لیے تیار ہیں؟
EUR/USD declines to 1.1090 during early Tuesday. That said, the pair failed to cross the confluence of 50-day SMA and 38.2% Fibonacci retracement of its October 01 to December 31 rise during the previous day.
As a result, the quote is expected to revisit the 100-day SMA support level of 1.1073. However, an upward sloping trend line since early-October, at 1.1068 could restrict the pair’s further downside.
In a case where sellers dominate below 1.1068, 50% And 61.8% Fibonacci retracement levels of 1.1060 and 1.1015 will return to the charts.
Meanwhile, pair’s sustained break above 1.1100/05 resistance confluence can trigger fresh recovery to 1.1130 and then to 23.6% Fibonacci retracement, a three-week-old falling trend line around 1.1155/60.
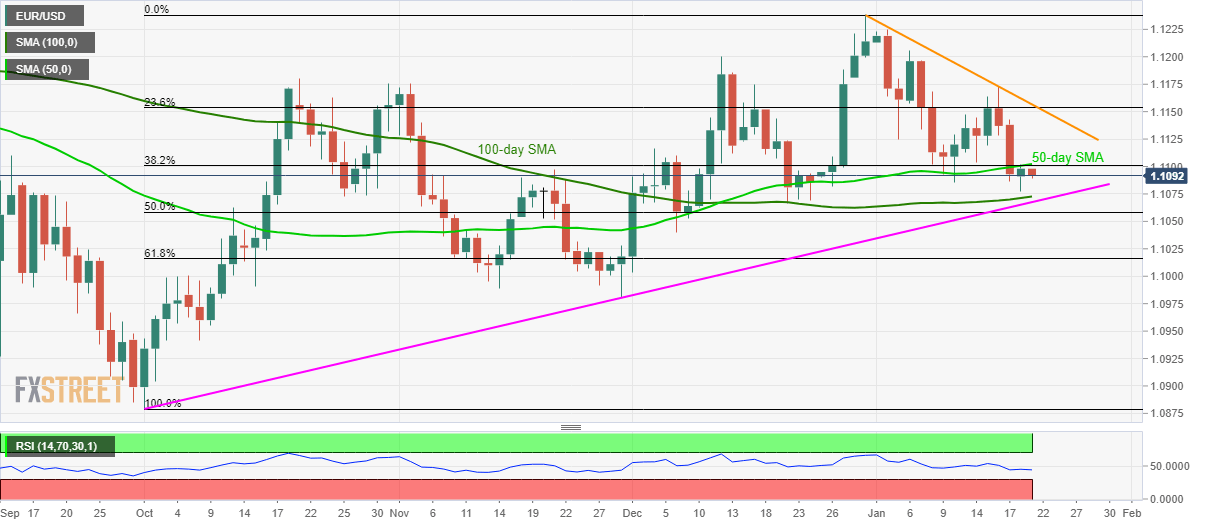
Trend: Bearish