এখন থেকে আমরা Elev8
আমরা শুধুমাত্র একটি ব্রোকার নই। আমরা একটি সর্বাত্মক ট্রেডিং ইকোসিস্টেম—বিশ্লেষণ, ট্রেড, এবং প্রবৃদ্ধির জন্য আপনার যা কিছু প্রয়োজন তা এক জায়গায়। আপনার ট্রেডিং উন্নত করতে প্রস্তুত?
আমরা শুধুমাত্র একটি ব্রোকার নই। আমরা একটি সর্বাত্মক ট্রেডিং ইকোসিস্টেম—বিশ্লেষণ, ট্রেড, এবং প্রবৃদ্ধির জন্য আপনার যা কিছু প্রয়োজন তা এক জায়গায়। আপনার ট্রেডিং উন্নত করতে প্রস্তুত?
USD/CAD takes the bids near 1.3085, the highest in two weeks, during the pre-European session on Wednesday. In doing so, the pair holds onto gains after successfully breaking 21-day EMA on a daily closing basis the previous day.
The buyers are now aiming 50-day EMA level of 1.3116 as the immediate resistance ahead of 50% Fibonacci retracement of the pair’s declines from September 2019 to January 01 low, near 1.3145.
In a case where the bulls remain dominant post-1.3145, 1.3180/85 has multiple upside barriers ahead of confronting 61.8% of Fibonacci retracement near 1.3200.
On the flip side, sellers will look for entry below the 21-day EMA level of 1.3070 while targeting the 1.3030 support level.
During the quote’s further downside below 1.3030, 1.3000 and 1.2960 can entertain the bears.
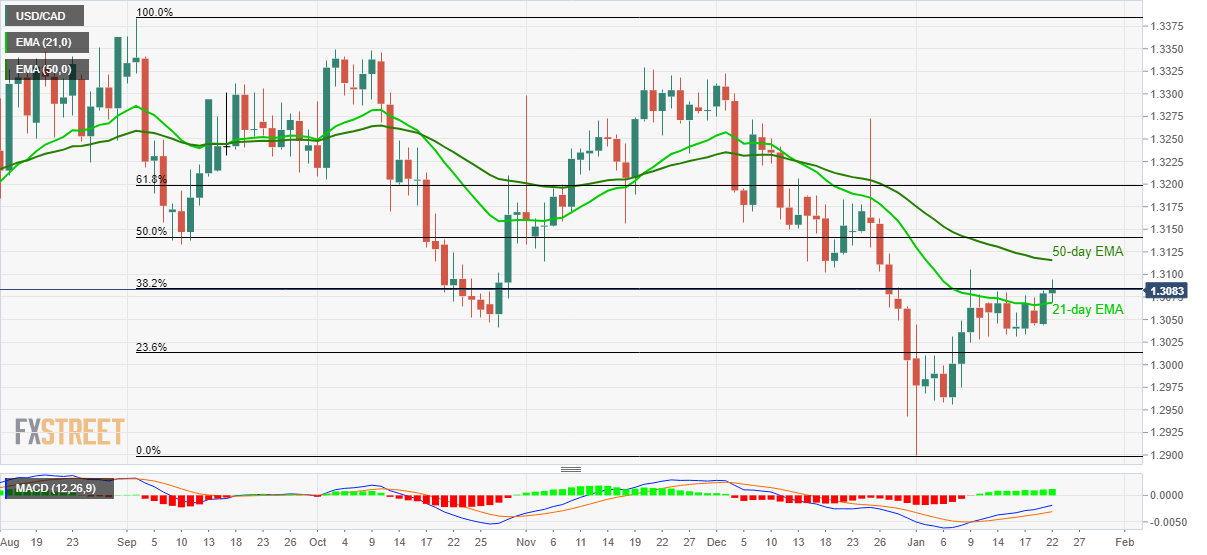
Trend: Bullish