এখন থেকে আমরা Elev8
আমরা শুধুমাত্র একটি ব্রোকার নই। আমরা একটি সর্বাত্মক ট্রেডিং ইকোসিস্টেম—বিশ্লেষণ, ট্রেড, এবং প্রবৃদ্ধির জন্য আপনার যা কিছু প্রয়োজন তা এক জায়গায়। আপনার ট্রেডিং উন্নত করতে প্রস্তুত?
আমরা শুধুমাত্র একটি ব্রোকার নই। আমরা একটি সর্বাত্মক ট্রেডিং ইকোসিস্টেম—বিশ্লেষণ, ট্রেড, এবং প্রবৃদ্ধির জন্য আপনার যা কিছু প্রয়োজন তা এক জায়গায়। আপনার ট্রেডিং উন্নত করতে প্রস্তুত?
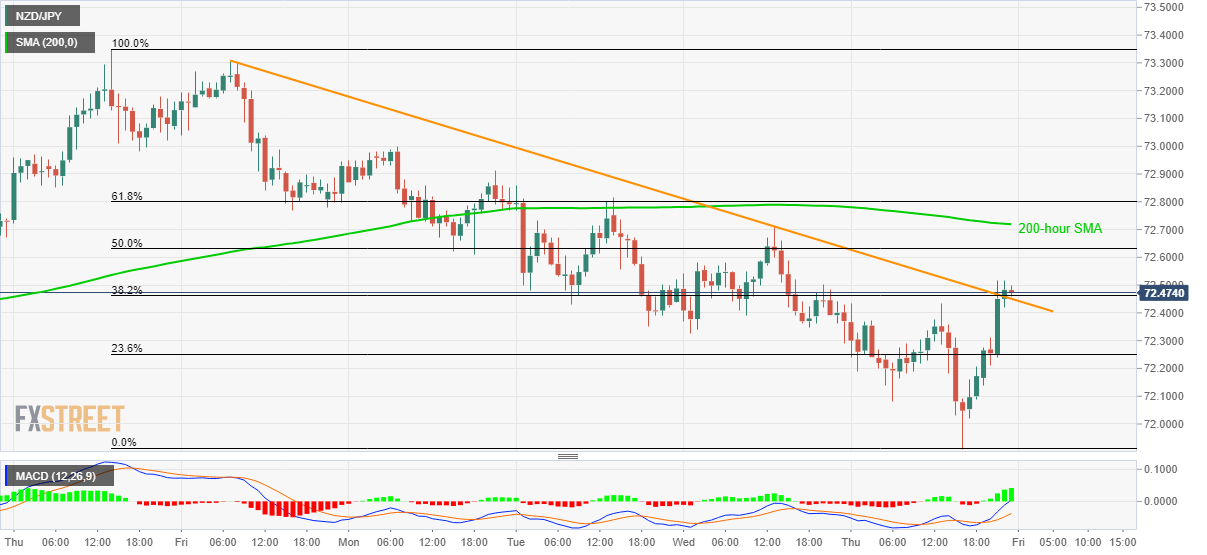
NZD/JPY takes the bids to 72.50 during early Friday morning in Asia. In doing so, the pair crosses a one-week-old falling resistance line. The buyers seem to cheer upbeat data from New Zealand while portraying the recent run-up.
Read: Breaking: New Zealand Q4 CPI: YoY 1.9% / QoQ 0.5% (NZD bullish)
A 200-hour SMA level of 72.72 is a nearby upside barrier that the bulls are currently targeting. Though, 61.8% Fibonacci retracement of the pair’s declines from January 16 to 23, at 72.80, could restrict the pair’s further advances.
In a case where the NZD/JPY prices rally beyond 72.80, 73.00 can offer an intermediate halt to the rise targeting January 16 top surrounding 73.35.
Alternatively, pair’s downside break below 23.6% Fibonacci retracement level of 72.25 can recall Thursday’s low of 71.91 ahead of challenging the monthly bottom near 71.25.
Trend: Bullish