Mulai sekarang kamiialah Elev8
Kami lebih daripada sekadar broker. Kami adalah ekosistem dagangan serba ada—semua yang anda perlukan untuk menganalisis, berdagang, dan berkembang ada di satu tempat. Sedia untuk tingkatkan dagangan anda?
Kami lebih daripada sekadar broker. Kami adalah ekosistem dagangan serba ada—semua yang anda perlukan untuk menganalisis, berdagang, dan berkembang ada di satu tempat. Sedia untuk tingkatkan dagangan anda?
GBP/USD stays weak while declining to the intra-day low of 1.3068 by the press time of Monday’s Asian session.
The pair registers three-day losing streak while also forming a lower high pattern if observed its moves from December 2019 top.
Even so, 50-day SMA and 61.8% Fibonacci retracement of the pair’s November-December upside, around 1.3065 and 1.3050 respectively, challenges the sellers.
If at all GBP/USD prices close below 1.3050, an upward sloping trend line since November 08, at .3015, followed by 1.3000 round-figure, will be the key to watch.
Alternatively, a daily closing beyond 50% Fibonacci retracement of 1.3142 can propel prices towards December 31, 2019’s top near 1.3285.
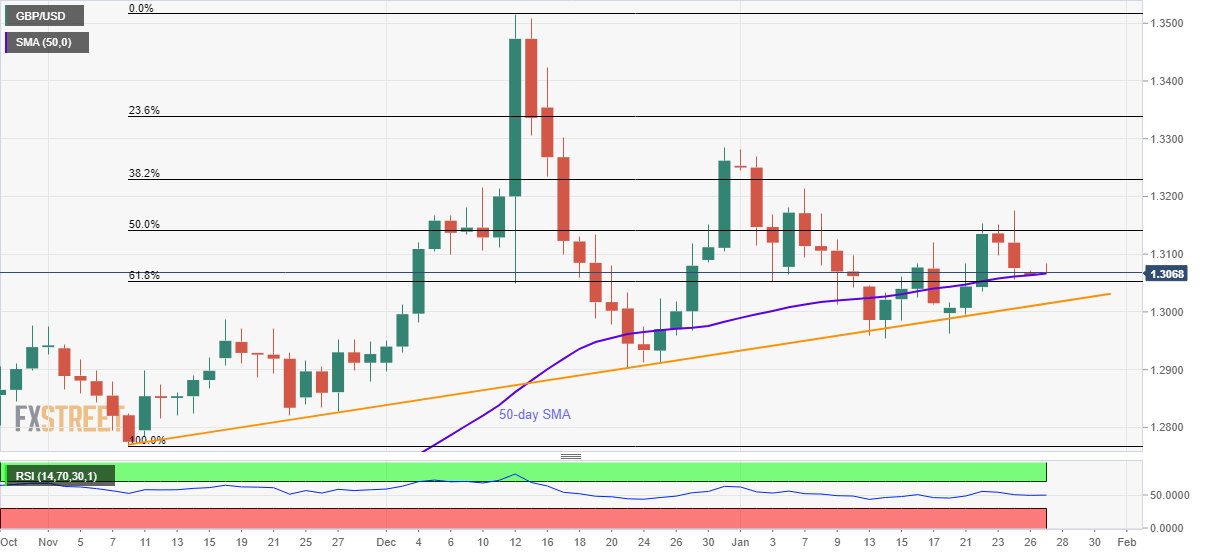
Trend: Pullback expected