اب سے ہم Elev8 ہیں
ہم صرف ایک بروکر نہیں ہیں۔ ہم ایک جامع ٹریڈنگ ایکوسسٹم ہیں—ہر چیز جو آپ کو تجزیے، ٹریڈ اور ترقی کے لیے درکار ہو، ایک ہی جگہ پر ہے۔ کیا آپ اپنی ٹریڈنگ کو بلند کرنے کے لیے تیار ہیں؟
ہم صرف ایک بروکر نہیں ہیں۔ ہم ایک جامع ٹریڈنگ ایکوسسٹم ہیں—ہر چیز جو آپ کو تجزیے، ٹریڈ اور ترقی کے لیے درکار ہو، ایک ہی جگہ پر ہے۔ کیا آپ اپنی ٹریڈنگ کو بلند کرنے کے لیے تیار ہیں؟
WTI takes the bids to $51.52 during Friday’s Asian session. The energy benchmark continues its previous two-day rise amid oversold RSI conditions.
Even so, 10-day SMA, near $51.83 now, limits the black gold’s immediate upside, a break of which could escalate the current recovery towards January 29 top of $54.37.
However, a confluence of 100 and 200-day SMA near $56.78/88 will challenge the quote’s rise above $54.37.
Meanwhile, the $50.00 round-figure might work as a trigger for selling. Should prices break below the said psychological mark, which is less likely considering oversold RSI, the monthly low surrounding $49.40 will return to the chart.
In a case where the bears dominate beneath $49.40, chances of witnessing a plunge towards late-December 2018 top surrounding $47.00 can’t be ruled out.
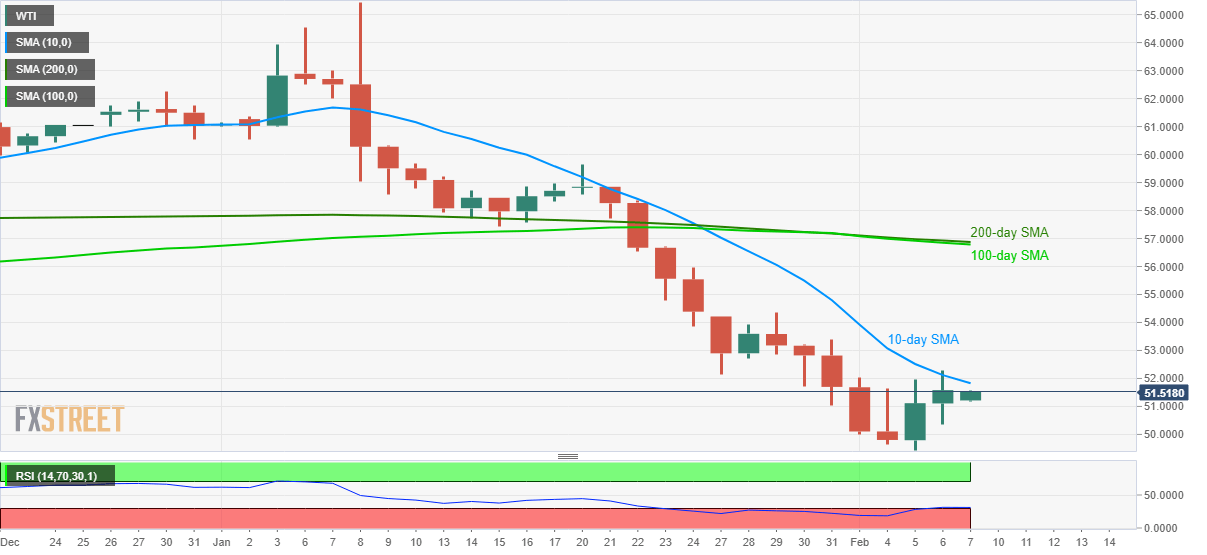
Trend: Further recovery expected