اب سے ہم Elev8 ہیں
ہم صرف ایک بروکر نہیں ہیں۔ ہم ایک جامع ٹریڈنگ ایکوسسٹم ہیں—ہر چیز جو آپ کو تجزیے، ٹریڈ اور ترقی کے لیے درکار ہو، ایک ہی جگہ پر ہے۔ کیا آپ اپنی ٹریڈنگ کو بلند کرنے کے لیے تیار ہیں؟
ہم صرف ایک بروکر نہیں ہیں۔ ہم ایک جامع ٹریڈنگ ایکوسسٹم ہیں—ہر چیز جو آپ کو تجزیے، ٹریڈ اور ترقی کے لیے درکار ہو، ایک ہی جگہ پر ہے۔ کیا آپ اپنی ٹریڈنگ کو بلند کرنے کے لیے تیار ہیں؟
Gold prices take the bids near $1,650, +0.84%, by the press time of early Thursday. With that, the bullion carries its U-turn marked on Wednesday.
The yellow metal recently reversed from $1,625 and is heading towards multiple resistances around $1,659.
Should prices manage to cross $1,659, as widely expected considering normal conditions of RSI and broadly bullish fundamentals, $1,673 may offer an intermediate halt before fueling prices to the latest high surrounding $1,690.
During the safe-haven’s run-up past-$1,690, $1,700 could please the bulls.
Alternatively, the precious metal’s declines below $1,625 will be challenged by a confluence of 50% Fibonacci retracement of its current month upside and an ascending trend line from February 12, close to $1,618.
In a case where the sellers dominate below $1,618, 61.8% Fibonacci retracement, at $1,601, holds the gate for further declines.
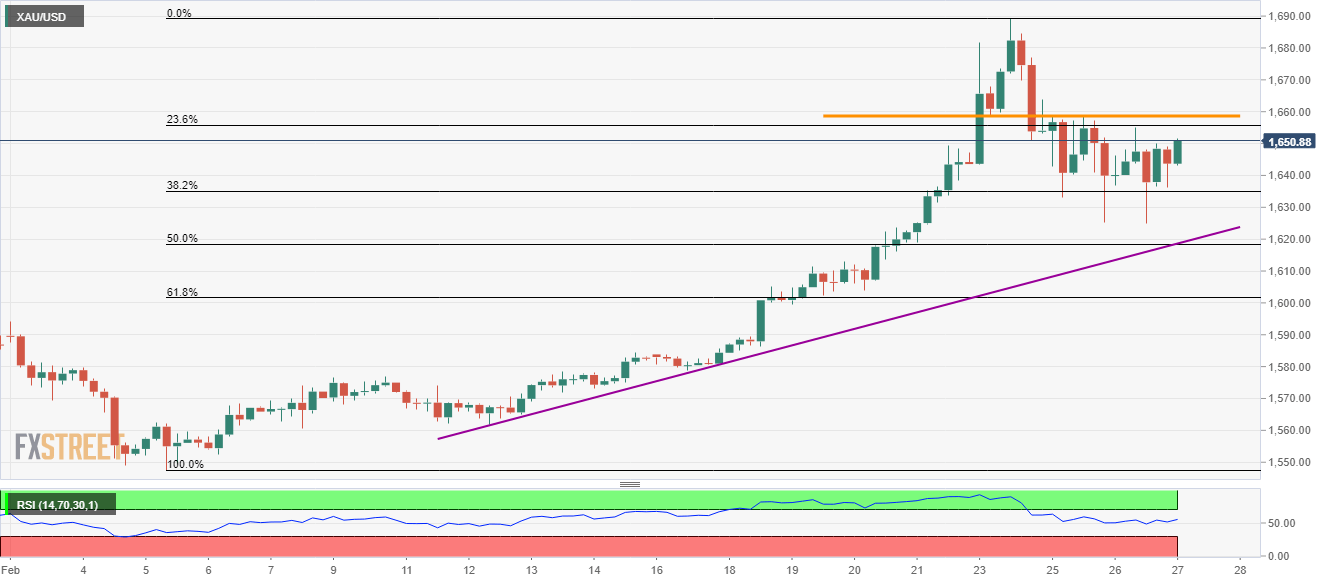
Trend: Bullish