এখন থেকে আমরা Elev8
আমরা শুধুমাত্র একটি ব্রোকার নই। আমরা একটি সর্বাত্মক ট্রেডিং ইকোসিস্টেম—বিশ্লেষণ, ট্রেড, এবং প্রবৃদ্ধির জন্য আপনার যা কিছু প্রয়োজন তা এক জায়গায়। আপনার ট্রেডিং উন্নত করতে প্রস্তুত?
আমরা শুধুমাত্র একটি ব্রোকার নই। আমরা একটি সর্বাত্মক ট্রেডিং ইকোসিস্টেম—বিশ্লেষণ, ট্রেড, এবং প্রবৃদ্ধির জন্য আপনার যা কিছু প্রয়োজন তা এক জায়গায়। আপনার ট্রেডিং উন্নত করতে প্রস্তুত?
GBP/JPY declines to 138.20 during the Asian session on Tuesday. In doing so, the pair stays within 50 and 61.8% Fibonacci retracements of its October-December upside amid mixed signals from technical indicators like RSI and MACD.
That said, the pair currently declines towards a 200-day SMA level of 137.65 ahead of re-testing 61.8% Fibonacci retracement, around 137.10.
Though, sellers will look for entry only if the pair provides a daily closing below 137.00. In doing so, September month high near 135.75 will be on their radars.
Meanwhile, buyers will wait for the pair’s daily close beyond 50% Fibonacci retracement level near 139.20 before confronting multiple resistances around 139.30/353.
Should there be a clear run-up beyond 139.35, 140.00 and early-February low near 141.00 will return to the charts.
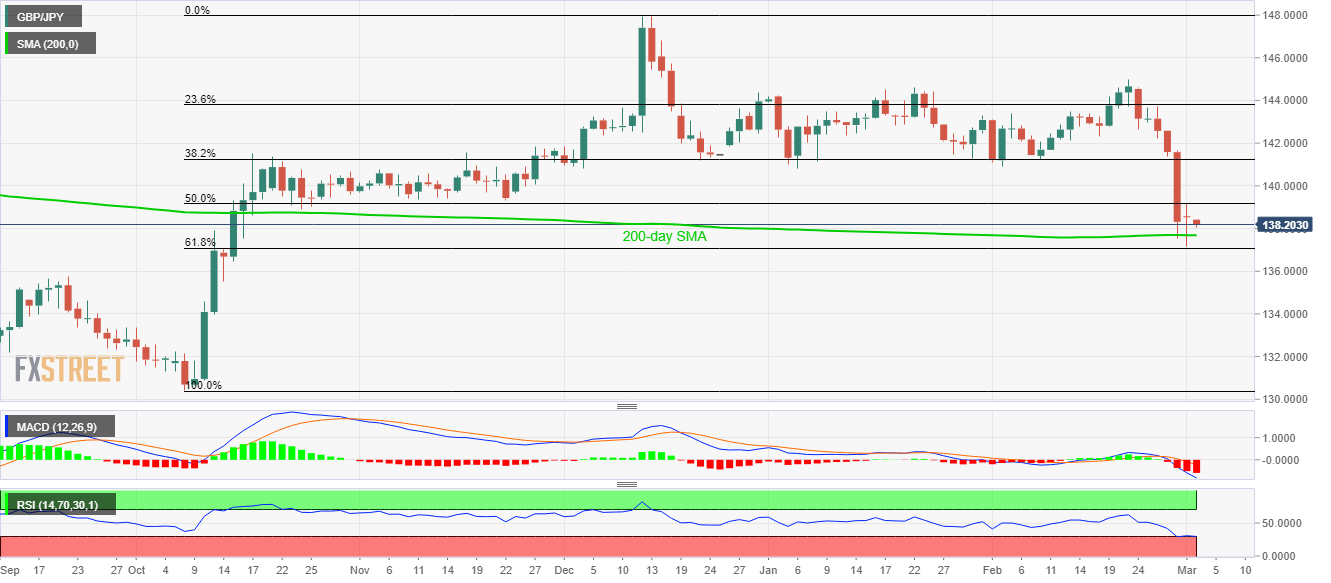
Trend: Bearish