اب سے ہم Elev8 ہیں
ہم صرف ایک بروکر نہیں ہیں۔ ہم ایک جامع ٹریڈنگ ایکوسسٹم ہیں—ہر چیز جو آپ کو تجزیے، ٹریڈ اور ترقی کے لیے درکار ہو، ایک ہی جگہ پر ہے۔ کیا آپ اپنی ٹریڈنگ کو بلند کرنے کے لیے تیار ہیں؟
ہم صرف ایک بروکر نہیں ہیں۔ ہم ایک جامع ٹریڈنگ ایکوسسٹم ہیں—ہر چیز جو آپ کو تجزیے، ٹریڈ اور ترقی کے لیے درکار ہو، ایک ہی جگہ پر ہے۔ کیا آپ اپنی ٹریڈنگ کو بلند کرنے کے لیے تیار ہیں؟
GBP/USD remains modestly changed while taking rounds to 1.2395 amid the Asian session on Friday. In doing so, the pair continues to stay below a short-term horizontal resistance and 21-day SMA support.
With RSI conditions also portraying the range-bound momentum, traders are less likely to be interested in the pair unless breaking 1.2495-1.2265 range.
It should also be noted that 1.2500 round-figure and 61.8% Fibonacci retracement of March month declines, at 1.2515, add to the upside barriers.
On the contrary, pair’s declines below 21-day SMA level of 1.2265 could take rest around 1.2135/30 ahead of testing 38.2% Fibonacci retracement level of 1.2090.
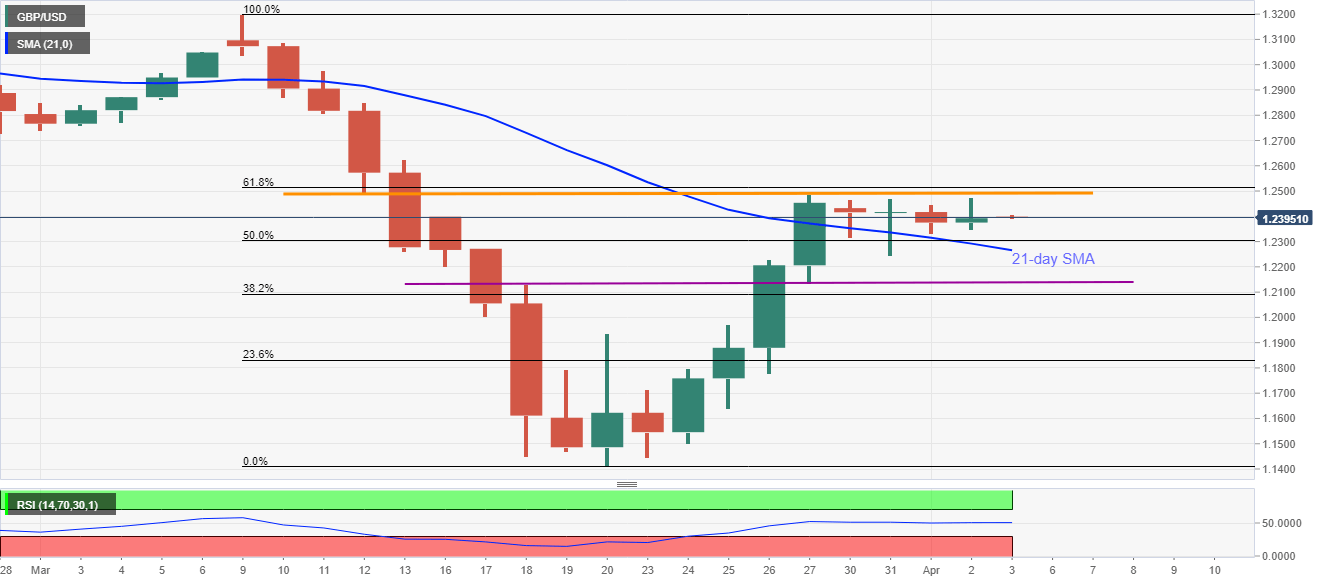
Trend: Sideways