Kể từ bây giờ chúng tôi là Elev8
Chúng tôi không chỉ là một nhà môi giới. Chúng tôi là một hệ sinh thái giao dịch tất cả trong một—mọi thứ bạn cần để phân tích, giao dịch và phát triển đều có ở một nơi. Sẵn sàng nâng tầm giao dịch của bạn?
Chúng tôi không chỉ là một nhà môi giới. Chúng tôi là một hệ sinh thái giao dịch tất cả trong một—mọi thứ bạn cần để phân tích, giao dịch và phát triển đều có ở một nơi. Sẵn sàng nâng tầm giao dịch của bạn?
NZD/USD takes the bids near 0.5960 during the early Tuesday. In doing so, the pair remains inside a one-week-old descending trend channel while also staying below 50% Fibonacci retracement of the previous month’s upside.
The kiwi pair’s ability to stay beyond 38.2% Fibonacci retracement, amid bullish MACD, seems to favor the buyers, which in turn questions the channel’s resistance, around 0.6000 now.
In a case where the bulls manage to successfully cross 0.6000 mark, a confluence of 200-bar SMA and 61.8% Fibonacci retracement near 0.6080/85 becomes crucial resistance.
On the contrary, the pair’s declines below 38.2% Fibonacci retracement level of 0.5845 needs validation through the channel’s support line, currently at 0.5830.
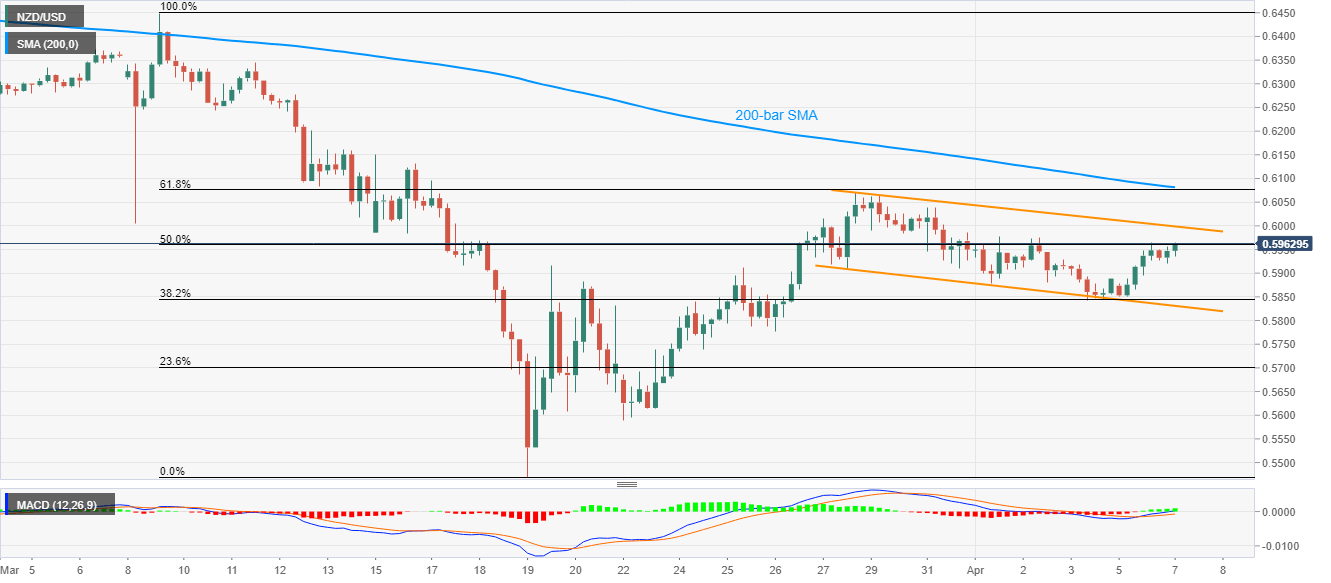
Trend: Further recovery expected