এখন থেকে আমরা Elev8
আমরা শুধুমাত্র একটি ব্রোকার নই। আমরা একটি সর্বাত্মক ট্রেডিং ইকোসিস্টেম—বিশ্লেষণ, ট্রেড, এবং প্রবৃদ্ধির জন্য আপনার যা কিছু প্রয়োজন তা এক জায়গায়। আপনার ট্রেডিং উন্নত করতে প্রস্তুত?
আমরা শুধুমাত্র একটি ব্রোকার নই। আমরা একটি সর্বাত্মক ট্রেডিং ইকোসিস্টেম—বিশ্লেষণ, ট্রেড, এবং প্রবৃদ্ধির জন্য আপনার যা কিছু প্রয়োজন তা এক জায়গায়। আপনার ট্রেডিং উন্নত করতে প্রস্তুত?
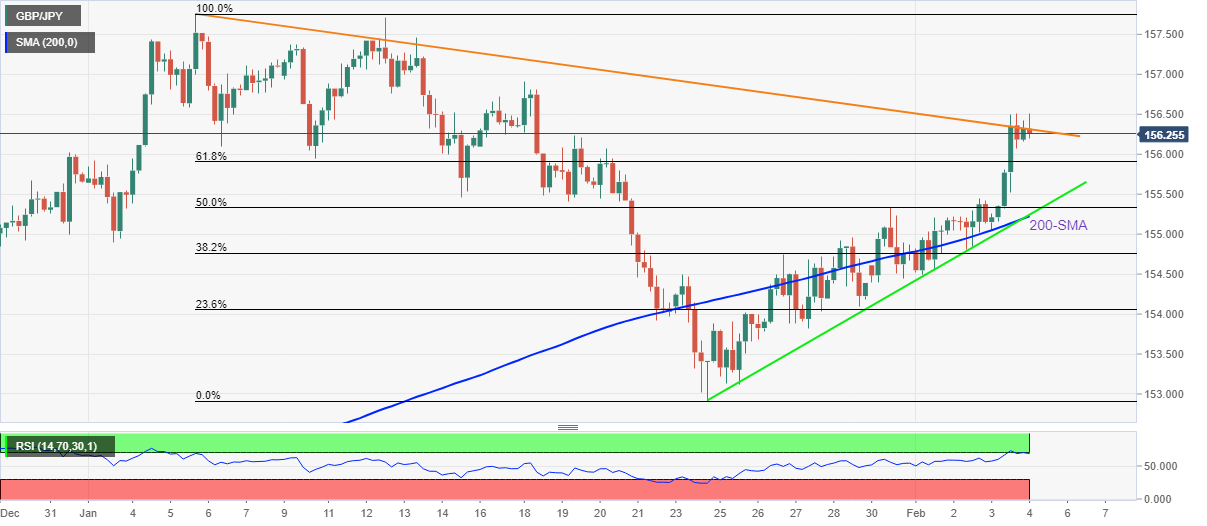
GBP/JPY struggles to extend the previous eight-day uptrend, retreating from an intraday high to 156.30 during Friday’s Asian session.
In doing so, the cross-currency pair justifies the overbought RSI conditions as a downward sloping trend line from January 05 challenges the bulls around 156.30.35.
It should be noted, however, that a pullback will initially aim for the 61.8% Fibonacci retracement level of January’s downturn, around 155.90.
However, a convergence of the 200-DMA and a three-week-long rising trend line, near 155.20, will challenge the GBP/JPY bears afterward.
On the contrary, an upside clearance of the 156.35 hurdle will GBP/JPY prices towards January 18 swing high near 156.90 and then to the 157.00 threshold.
In a case where GBP/JPY buyers manage to keep reins past 157.00, multiple hurdles around 157.40-50 will be crucial for a watch.
Trend: Further weakness expected